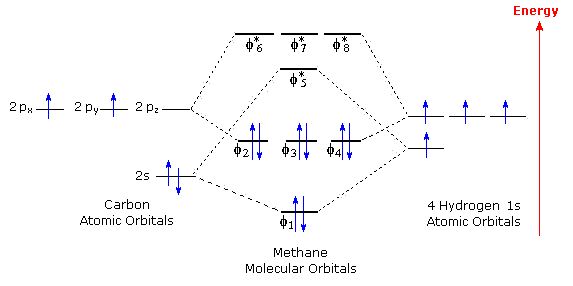
Sigma and pi covalent bond models have proven to be valuable tools for describing the structure and reactivity of simple molecules, such as methane and ethene. However, such models do not accurately represent the electron distribution within the molecules. In the case of methane, this model implies four eqivalent localized orbitals between the hydrogen atoms and the central carbon. However, the following orbital correlation diagram shows one lower energy occupied orbital and three degenerate higher energy occupied orbitals. All of these bonding molecular orbitals, designated φ, are delocalized and encompass several nuclei; but in each case there is a region of electron density between the carbon and more than one hydrogen. There are, of course four unoccupied antibonding orbitals having still higher energies.

In the following model, the carbon atom is dark gray and the hydrogens are cyan. The hydrogen atoms are arbitrarily numbered. A molecular orbital will be displayed by pressing the appropriate button.The different phases of the molecular orbitals are colored red and blue and are separated by nodal surfaces at which electron density is zero.
| φ1-Bonding Orbital | ||
|---|---|---|
| φ2-Bonding Orbital | φ3-Bonding Orbital | φ4-Bonding Orbital |
| φ*5-AntiBonding Orbital | ||
| φ*6-Bonding Orbital | φ*7-Bonding Orbital | φ*8-Bonding Orbital |