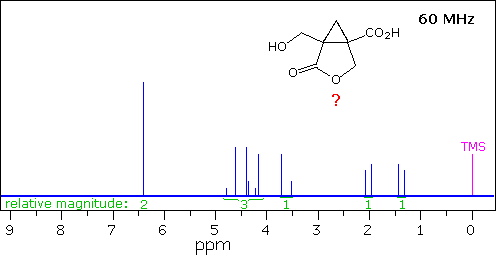
The 60 MHz 1Hnmr spectrum of a C7H8O5 compound in DCCl3 solution is shown above. A possible structure for this compound is drawn above the spectrum.

The 60 MHz 1Hnmr spectrum of a C7H8O5 compound in DCCl3 solution is shown above. A possible structure for this compound is drawn above the spectrum.