Instructions for visualizing Gaussian results with molden
molden is a free visualization prgram which allows easy visualization
of results of quantum chemistry calculations. It supports output files from
many packages such as gaussian, MOPAC etc. In this class we would be
interested in viewing Gaussian calculations with molden.
To start molden
cd to the directory containing your gaussian output file.
Now on the unix prompt, simply type molden.
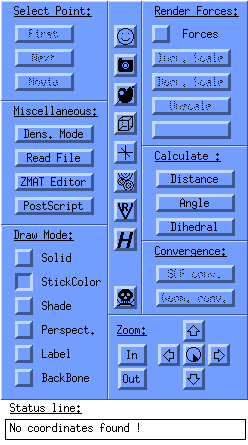
you will see two windows open up on your screen. One large black window
(where the molecules will be viewed) and one small control window through
which you control the program. The control window looks as follows:
Note: The following picture and some of the text and pictures below
have been copied from the website
http://www.kncv.nl/samsam/symp970526/molden/. You may want to visit it for a more formal
short tutorial on molden

Reading a gaussian output file into molden
You have to press the read button to read in a gaussian output file into molden.
On pressing read, a dialog box will open which will show all the files in the
current directory ( i.e. the directory you were in when you started molden ). If you have
a gaussian output file in the current directory, click on it and molden will immediately
draw the molecule on the black visualization window. Once the molecule is displayed here,
you can do other things with it ( read on... )
Viewing vibrational modes with molden
If the gaussian file you have opened is a frequency calculation, you can view the various
normal modes of vibrations of this molecule. To do that, press the Normal modes
button on the top right hand side of the control window. You will see a window with a list
of frequencies. These are the frequencies of normal modes of vibration of the molecule.
Select the frequencies one by one to see what the molecular motion is in that mode.
A short description of the Molden interface
The left button row:
- Select point:
- first displays the first frame of an animation
- next displays the next frame of an animation
- movie plays the series of frames as a movie
Note: The animation here for you would be the series of steps gaussian took
get to the optimized geometry ( if this is an geom. optimization output file you have
opened ) Try it.
- Miscellaneous:
- read file to open a file
- ZMAT editor to manually edit and save Z-matices
- PostScript to save the current frame as a postscript file
- Draw mode:
- Solid for solid molecules
- StickColor for coloured sticks
- Shade, Perspective, Label all speak for themselves
- Backbone displays only the backbone of proteins
The middle row of buttons:
 about the autor
 make gif screencapture
 change background colour
 cell data
 set origin
 charges setup
 save vrml output
 change disply hydrogens
 exit Molden
Some of the functions at the left:
- Calculate to calculate the distance, angle and dihedral angle
- Geom. Conv. shows an energy plot as function of the conversion; you can click in this energy plot to see the frame of a specific energy.
- Zoom buttons: the 'clock' is to set the step size of rotation.
In the viewing area, you can rotate the molecule by keeping the left mouse button pressed in an area to the top, bottom, left or right of the molecule.


 about the autor
 make gif screencapture
 change background colour
 cell data
 set origin
 charges setup
 save vrml output
 change disply hydrogens
 exit Molden